Community Report Q2 2023
This report provides API3 community growth and engagement statistics for Q2 2023, including comparison charts dating back to July 2022 and API3 product usage analytics. The complete report of 2022 can be found here, and should not to be confused with the API3 Recap 2022, which highlights the development progress and achievements of the various teams contributing to the API3 DAO.
While this report provides valuable insights, interpreting the data to evaluate the community’s health and growth requires a holistic approach considering multiple factors and sources that might involve objective and subjective elements. Thus, this report does not include any conclusions about the overall state of the community, and anyone’s perspective might vary based on their interpretation of the presented information.
Discourse


The forum’s membership count increased by 49 during the first six months of 2023. Furthermore, there has been a slight upward trend in the message count since December last year. While the engagement is lower than in the first half of 2022, the forum remains a relevant platform for discussion and exchanging ideas. The average number of pageviews during the first half of 2023 equals approximately 13,900, a decrease of about 4.8% compared to the second half of 2022. None of the statistics include forum crawlers.
Discord


There has been a consistent increase in Discord membership. Despite the decline in message activity since March, the overall message count is still slightly higher compared to Q1. General continues to be the most active channel, followed by #dev-support and qrng.
Telegram


The steady decrease in the number of members on Telegram may be attributed to our emphasis on Discord as the primary platform for developer support and community engagement. Furthermore, there has been a downtrend in message count since March throughout most of Q2, with a reversal to the upside in June. This upward trend may be short-lived, as the increase in message activity is primarily attributed to a public debate that happened that month.


The growth in the number of Twitter followers has continued to increase, with the count reaching approximately 48,300 by the end of Q2 2023. During this period, the engagement rate averaged 4.10%, which is slightly higher than the overall mean of 3.92% for 2022 and the average of 3.67% recorded during Q1 of 2023. The engagement rate of 5.4% in May is the highest since August 2022, but the level of engagement was not sustained in the following month.


Although there has been a slight rise in the number of subscribers on Reddit for the past twelve months, it is noteworthy that the total pageviews have been strongly declining for almost the entire period.
YouTube


| Q2 Video Statistics | |||
|---|---|---|---|
| Video | Views | Impressions | CTR Rate |
| Unstake and Claim | 126 | 556 | 8.50% |
| Staking Page Overview | 113 | 678 | 7.10% |
| Stake and Earn | 112 | 685 | 9.30% |
| API3 Market dashboard | 91 | 1071 | 4.60% |
| API3 QRNG dynamic NFT | 69 | 394 | 4.80% |
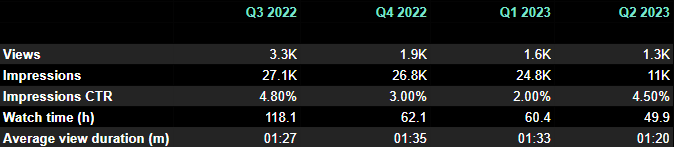
There has been a slight decline in the number of subscribers on YouTube, and total views have decreased by almost 30% since Q1. Furthermore, impressions have declined by more than 50%, but the click-through rate has increased by more than double. This may indicate that although the content is displayed to a smaller audience, it resonates better with the audience.
API3 Product Usage Analytics

During the second quarter of 2023, the total number of QRNG fulfillment amounted to 121,084, marking a 22.76% increase compared to Q1. To access more analytics regarding QRNG usage, please visit the QRNG Monitoring page.